


So, I ran a little experiment—because what’s life without overfitting just for fun? I compared five regression models on two very different housing datasets …
🏘️ Ames Housing:
Rich, detailed, and multi-dimensional. Think of it like the Swiss Army knife of regression datasets.
🌴 California Housing:
Simplified down to a single feature — Median Income. Basically, the minimalist’s dream.
Models Compared:
- Linear Regression
- Decision Tree
- Random Forest
- XGBoost
- K-Nearest Neighbors (KNN)
Each GIF below shows how performance evolved over time. We’re talking train vs. test R² scores, visible over iterations—plus those visual cues you love that scream “Hey, this one’s overfitting!” or “Yeah… this one’s basically guessing.”
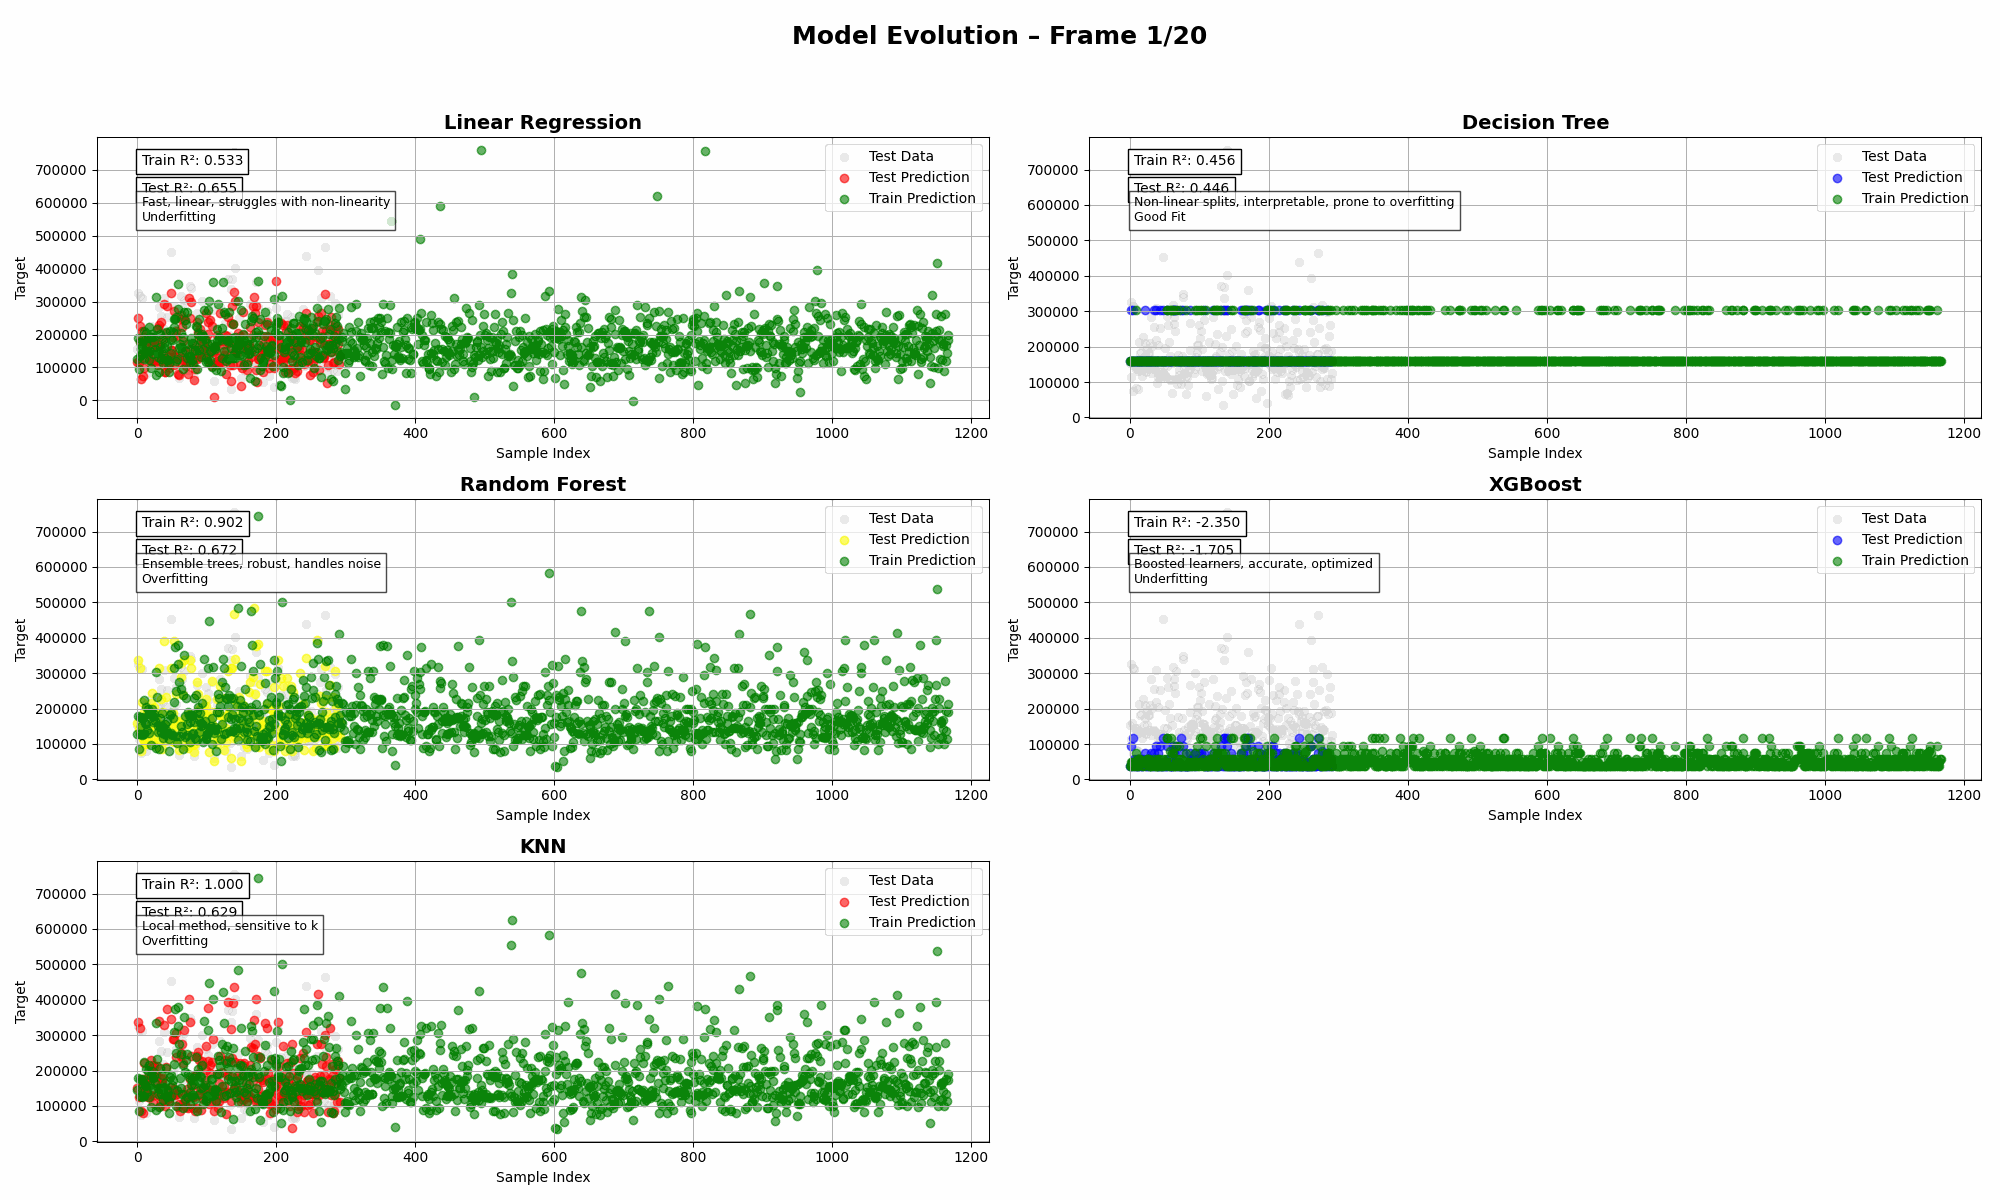
Ames Housing (Multi-Feature)
➡️ Insights:
- Random Forest flexed its muscles here, but KNN and XGBoost? Classic cases of either overfitting or just not showing up to work.
- Linear Regression held its own—shocking, I know—thanks to the strength of the underlying features.
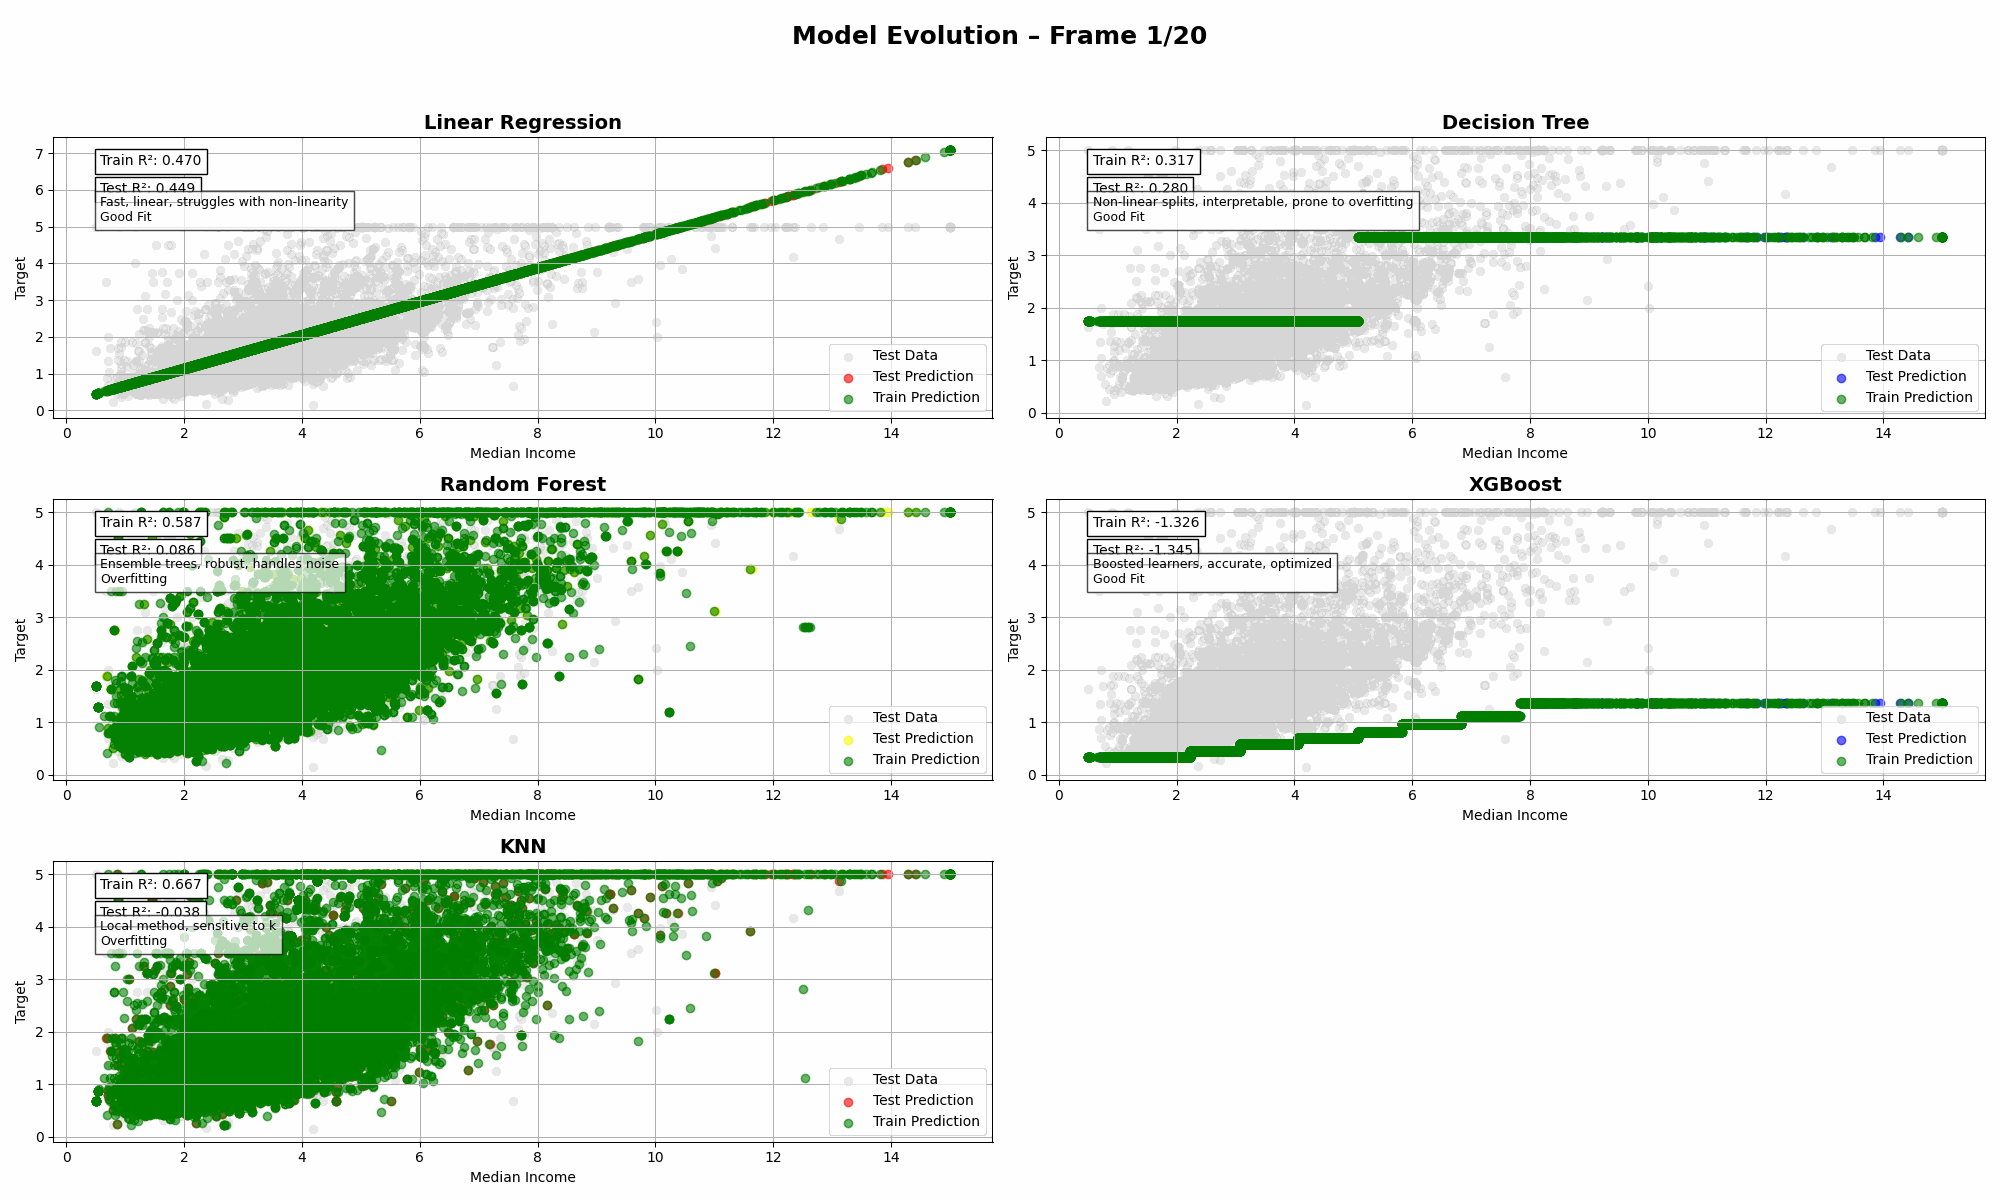
California Housing (1 Feature: Median Income)
➡️ Insights:
- When you only have one strong feature, even simple models like Linear Regression can outperform fancier methods.
- Most complex models struggled with generalization. XGBoost in particular had a rough day.
💡 Takeaways:
✔️ Model choice matters; but data quality and feature strength matter more
✔️ Overfitting is real. Watch those training R² scores spike while test performance nosedives
✔️ KNN is great… if you enjoy chaos
✔️ Don’t blindly trust complexity to save the day
So, which model would you bet on in each case?
📩 Drop your thoughts in the comments or connect with me on LinkedIn. Always down to talk shop (or rant about why XGBoost occasionally betrays us).
#MachineLearning #ModelEvaluation #DataScience #RegressionModels #XGBoost #RandomForest #ModelOverfitting #HousingData #AmesHousing #CaliforniaHousing #KNN #LinearRegression
