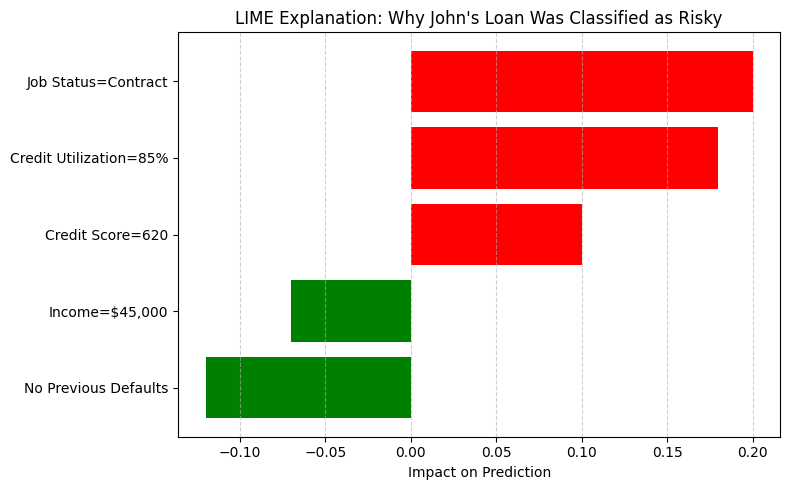
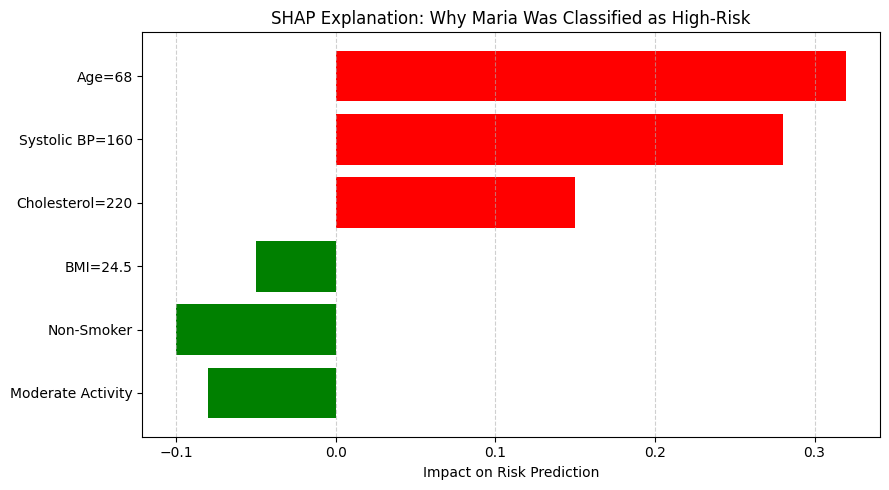
In the growing field of explainable AI, tools like LIME and SHAP have made it possible to peek inside complex models and understand their reasoning. But just because a model can explain itself doesn’t mean every explanation is meaningful or trustworthy.
Evaluating the Quality of Explanations
Not all explanations are created equal. For an explanation to be useful in practice, it must do more than highlight inputs or display weights. It needs to behave reliably and reflect how the model actually works.
Two critical properties help assess that:
1. Consistency
A good explanation should behave consistently. That means:
- If you train the same model on different subsets of similar data, the explanations should remain relatively stable.
- Small changes to input data shouldn’t lead to dramatically different explanations.
Inconsistent explanations can confuse users, misrepresent what the model has learned, and signal overfitting or instability in the model itself.
2. Faithfulness
Faithfulness asks a simple but powerful question: Do the features highlighted in the explanation actually influence the model’s prediction?
An explanation is not faithful if it attributes importance to features that, when changed or removed, don’t affect the outcome. This kind of misleading output can erode trust and create false narratives around how the model operates.
Why These Metrics Matter
In sensitive applications like healthcare, lending, or security, misleading explanations are more than just technical flaws. They can have real-world consequences.
- Imagine a credit scoring model that cites a user’s browser history or favorite color as key decision drivers. Even if the model is technically accurate, such explanations would damage its credibility and raise ethical and legal concerns.
- In regulated industries, explanations that fail consistency or faithfulness checks can expose organizations to compliance risks and reputational damage.
Real-World Examples
Faithfulness Test: Credit Risk Model
A faithfulness test was applied to a credit risk model used to classify applicants as “high” or “low” risk. The SHAP explanation highlighted feature A (e.g., number of bank accounts) as highly important.
To test faithfulness, this feature was removed and the model’s prediction didn’t change … at all!
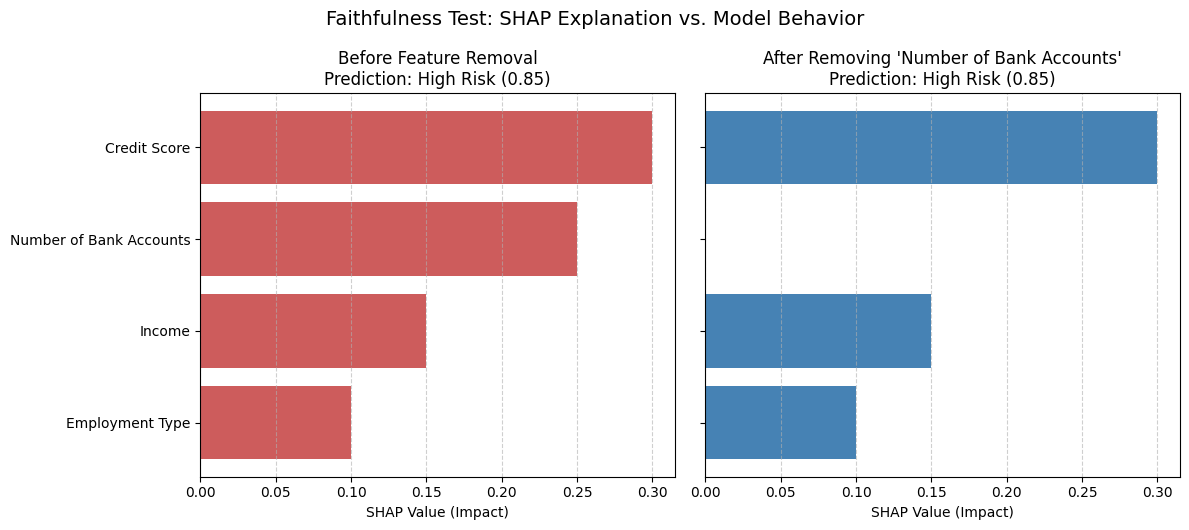
What the graph shows:
- SHAP value for “Number of Bank Accounts” was +0.25 (suggesting a major contribution).
- But after removing it, the model’s risk prediction stayed the same, proving that this feature wasn’t actually influencing the output.
This revealed a serious problem: the model was producing unfaithful explanations. It was surfacing irrelevant features as important, likely due to correlation artifacts in the training data.
Consistency Test: Credit Risk Model
A credit scoring model was trained on two different but similar subsets of loan application data. Both versions produced the same prediction for an applicant: “high risk”, but gave very different explanations.
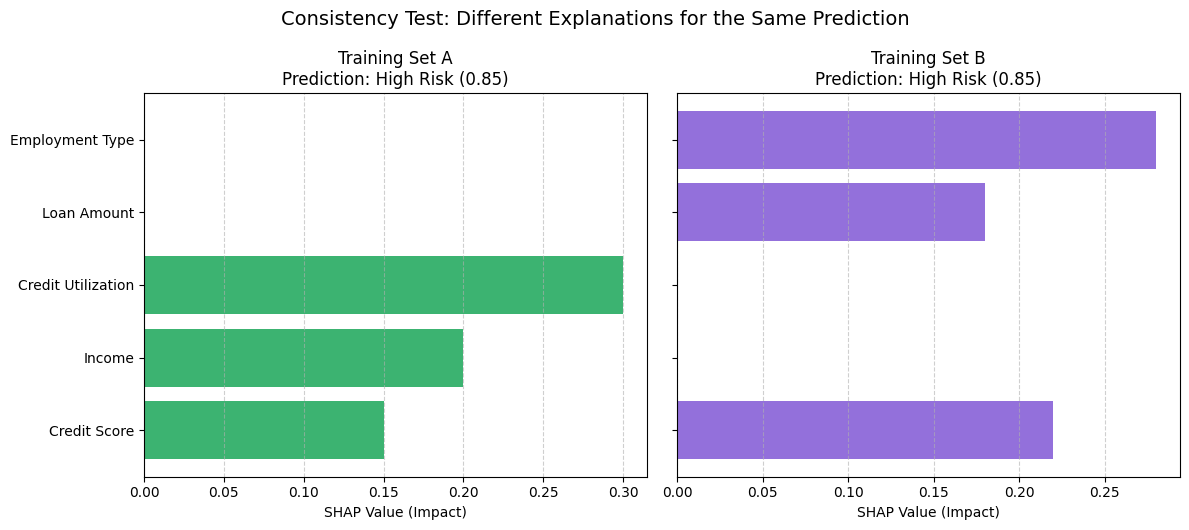
What the graph shows:
- In Training Set A, the top contributing feature was “Credit Utilization” (+0.3).
- In Training Set B, it was “Employment Type” (+0.28).
- The SHAP bar charts for the same applicant looked noticeably different, even though the final decision didn’t change.
This inconsistency raised questions about model stability: Can we trust that the model is learning the right patterns, or is it too sensitive to the training data?
Final Thoughts
As AI systems continue to make critical decisions in our lives, explainability is not a luxury, it’s a necessity. Tools like LIME and SHAP offer a valuable window into how models work, but that window needs to be clear and reliable.
Metrics like consistency and faithfulness help us evaluate the strength of those explanations. Without them, we risk mistaking noise for insights, or worse, making important decisions based on misleading information.
Accuracy might get a model deployed, but consistency and faithfulness should decide its validity and trust. If you want to learn more about explainability in AI, please check this blog post, where I talk about how LIME and SHAP can help explain model outcomes.