Understanding Model Decisions with SHAP and LIME
Academic Writing, Data Science, My Digital Universe

What Made the Model Say That? Real Examples of Explainable AI

When people talk about artificial intelligence, especially deep learning, the conversation usually centers around accuracy and performance. How well does the model classify images? Can it outperform humans in pattern recognition? While these questions are valid, they miss a crucial piece of the puzzle: explainability.

Explainability is about understanding why an AI model makes a specific prediction. In high-stakes domains like healthcare, finance, or criminal justice, knowing the why is just as important as the what. Yet this topic is often overlooked in favor of performance benchmarks.

Why Is Explainability Hard in Deep Learning?

Classical models like decision trees (e.g., CART) offer built-in transparency. You can trace the decision path from root to leaf and understand the model’s logic. But deep learning models are different. They operate through layers of nonlinear transformations and millions of parameters. As a result, even domain experts can find their predictions opaque.

This can lead to problems:

  • Lack of trust from users or stakeholders
  • Difficulty debugging or improving models
  • Potential for hidden biases or unfair decisions

This is where explainability tools come in.

Tools That Help Open the Black Box

Two widely used frameworks for model explanation are LIME (Local Interpretable Model-agnostic Explanations) and SHAP (SHapley Additive exPlanations). Both aim to provide insights into which features influenced a specific prediction and by how much.

LIME in Action

LIME works by perturbing the input data and observing how the model’s predictions change. For instance, in a text classification task, LIME can highlight which words in an email led the model to flag it as spam. It does this by creating many variations of the email (e.g., removing or replacing words) and observing the output.

Loan Risk Example:

  • A model classifies a loan application as risky. We will use John as an example.
  • We want to find the reasons as to why their application was labeled as risky.
  • LIME reveals that the applicant’s job status and credit utilization were the two most influential factors.

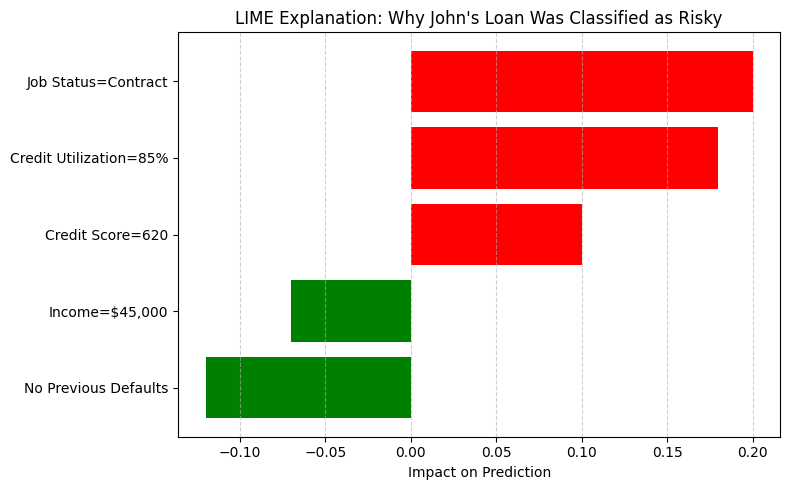
LIME reveals that the model flagged John’s loan as risky mainly due to his contract employment status and high credit utilization. Although John had no previous defaults and a moderate income, those factors were outweighed by the others in the model’s decision.

SHAP in Practice

SHAP uses concepts from cooperative game theory to assign each feature an importance value. It ensures a more consistent and mathematically grounded explanation. SHAP values can be plotted to show how each input feature pushes the prediction higher or lower.

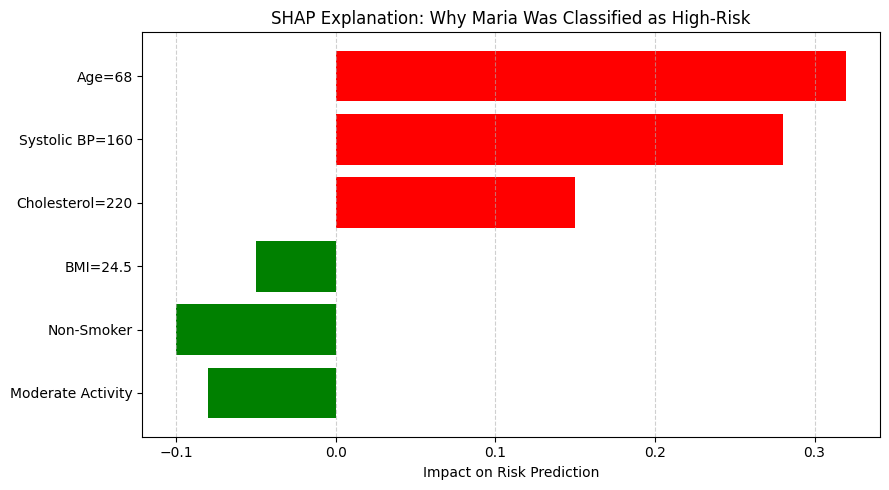
Medical Diagnosis Example:

  • Let’s use Maria as an example, after her information was entered into the system, she was classified as high risk by the model
  • To understand as to what factors contributed to that classification, we can use SHAP. SHAP shows that age and blood pressure significantly contributed to a high-risk prediction.
  • These insights help physicians verify if the model aligns with clinical reasoning.

Final Thoughts

The examples of Maria and John illustrate a powerful truth: even highly accurate models are incomplete without explanations. When a model labels someone as high-risk, whether for a disease or a loan default, it’s not enough to accept the outcome at face value. We need to understand why the model made that decision.

Tools like LIME and SHAP make this possible. They open up the black box and allow us to see which features mattered most, giving decision-makers the context they need to trust or challenge the model’s output.

Why Explainability Matters in Business:

  • Builds trust with stakeholders
  • Supports accountability in sensitive decisions
  • Uncovers potential biases or errors in the model
  • Aligns predictions with domain expertise

As AI becomes more embedded in real-world systems, explainability is not optional; it’s essential. It turns predictions into insights, and insights into informed, ethical decisions.

Good AI model evaluations doesn’t stop at explainability. Learn the importance of consistency and faithfulness and see why it matters by checking out this post.

Bar chart showing ChatGPT and BERT agreement with researcher sentiment labels for positive, negative, and neutral categories
Academic Writing, Data Science, My Digital Universe, Portfolio

How Good is Sentiment Analysis? Even Humans Don’t Always Agree

Sentiment Analysis Is Harder Than It Looks

Sentiment analysis is everywhere: from analyzing customer reviews to tracking political trends. But how accurate is it really? More importantly, how well can machines capture human emotion and nuance in text?

To answer that, I conducted a real-world comparison using a dataset of healthcare-related social media posts. I evaluated the performance of two AI models : ChatGPT and a BERT model fine-tuned on Reddit and Twitter data against human-coded sentiment labels. I used the fine-tuned BERT model and the dataset as part of my Ph.D dissertation. So this was already available to me. More information on the BERT model can be found in my disseration.

The results tell an interesting story about the strengths and limitations of sentiment analysis; not just for machines, but for humans too.

ChatGPT vs. BERT: Which One Came Closer to Human Labels?

Overall, ChatGPT performed better than the BERT model:

  • ChatGPT reached 59.83% agreement with human-coded sentiments on preprocessed text (meaning I used the dataset I used for the BERT model)
  • On raw text, agreement was 58.52% (here, I used the same dataset I provided the second human coder, without any preprocessing like lemmatization, etc)
  • The BERT model lagged behind in both scenarios

This shows that large language models like ChatGPT are moving sentiment analysis closer to human-level understanding; but the gains are nuanced. See below image that shows ChatGPT vs the Trained BERT agreement levels with my coding for each Reddit post. Note that this was when I used the preprocessed dataset and generated the ChatGPT output.

Class-by-Class Comparison: Where Each Model Excels

Looking beyond overall scores, I broke down agreement across each sentiment class. Here’s what I found:

  • Neutral Sentiment: ChatGPT led with 64.76% agreement, outperforming BERT’s 44.76%.
  • Positive Sentiment: BERT did better with 66.19% vs. ChatGPT’s 41.73%.
  • Negative Sentiment: Both struggled, with BERT at 26.09% and ChatGPT at 17.39%.

These results suggest that ChatGPT handles nuance and neutrality better, while BERT tends to over-assign positivity; a common pattern in models trained on social platforms like Reddit and Twitter.

But Wait … Even Humans Don’t Fully Agree

Here’s where it gets more interesting! When comparing two human coders on the same dataset, agreement was just 72.79% overall. Class-specific agreement levels were:

  • Neutral: 91.8%
  • Negative: 60%
  • Positive: Only 43.6%

This mirrors the model behavior. The subjectivity of sentiment, especially when it comes to borderline cases or ambiguous language, is challenging even humans!

Why Sentiment Is So Difficult … Even for Humans

As discussed in my dissertation, sentiment classification is impacted by:

  • Ambiguous or mixed emotions in a single post
  • Sarcasm and figurative language
  • Short posts with little context
  • Different human interpretations of tone and intent

In short: Sentiment is not just about word choice, it’s about context, subtlety, and perception. I tackle this in much more depth in my dissertation. So, if you want to read more about what other researchers are saying, I suggest you refer to Chapter 5, where I talk about sentiment analysis issues, explanations, and implications.

Here is the Spiel

  • ChatGPT outperformed a Reddit-Twitter trained BERT model in both overall accuracy and especially on neutral sentiment.
  • Positive and negative sentiment remain harder to classify, for both models and humans.
  • Even human coders don’t always agree, proving that sentiment is a subjective task by nature.
  • For applications in healthcare, finance, or policy; where precision matters, sentiment analysis needs to be interpreted carefully, not blindly trusted.

Final Thoughts

AI is getting better at understanding us, but it still has blind spots. As we continue to apply sentiment analysis in real-world domains, we must account for ambiguity, human disagreement, and context. More importantly, we need to acknowledge that even “ground truth” isn’t always absolute.

Let’s keep pushing the boundaries, but with a healthy respect for the complexity of human emotion.

Animated comparison of regression models showing bias, variance, and prediction accuracy
Academic Writing, Data Science, My Digital Universe, Portfolio

🎢 Bias, Variance & the Great Regressor Showdown

Imagine throwing five regressors into the same ring, giving them the same dataset, and watching them wrestle with reality. That’s what this animation is all about: a visual deep dive into bias, variance, and model complexity—without the textbook-level headache.

The models in play

Five well-known regression models, one smooth sinusoidal target function, and a bunch of noisy data points:

  • Linear Regression – The straight-line enthusiast.
  • Decision Tree – Thinks in boxes, and sometimes forgets how to generalize.
  • Random Forest – The chill ensemble kid who smooths out the chaos.
  • XGBoost – The overachiever with a calculator and an ego.
  • KNN – Your nosy neighbor who always asks, “What are your closest friends doing?”

🎥 The Animation:


The Concepts in Play

🎯 Bias

Bias refers to the error introduced when a model makes overly simplistic assumptions about the data. In other words, it is what happens when the model is too rigid or inflexible to capture the true patterns.

Take Linear Regression for example:

“Let’s pretend everything is a straight line.”

That assumption may work in some cases, but when the data contains curves or more complex relationships, the model cannot adapt. This leads to underfitting, where the model performs poorly on both training and test data because it has failed to learn the underlying structure.


🎢 Variance

Variance measures how sensitive a model is to fluctuations or noise in the training data. A high variance model learns the data too well, including all the random quirks and outliers, which means it performs well on the training set but poorly on new data.

This is typical of models like Decision Trees and KNN:

“I will memorize your quirks and your noise.”

These models often produce excellent training scores but fall apart during testing. That gap in performance is a red flag for overfitting, where the model has essentially memorized instead of generalized.


🤹 Model Complexity

Model complexity describes how flexible a model is in fitting the data. A more complex model can capture intricate patterns and relationships, but that flexibility comes at a cost.

More complexity often means the model has a higher risk of chasing noise rather than signal. It may give impressive training performance but fail when deployed in the real world. Complex models also tend to be harder to interpret and require more data to train effectively.

So while complexity sounds appealing, it is not always the answer. Sometimes the simplest model, with fewer moving parts, delivers the most reliable results.


💡 What We Learn from the GIF

  • Linear Regression has high bias. It’s smooth but can’t capture curves.
  • Decision Tree slices the data too rigidly. Prone to overfitting.
  • Random Forest balances bias and variance quite well (💪).
  • XGBoost tries to win—but often needs careful tuning to avoid bias.
  • KNN loves to follow the data closely, sometimes too closely.

Why This Matters (a lot)

In the real world:

  • Underfitting leads to useless predictions.
  • Overfitting leads to confident but wrong predictions.
  • Balanced models win in production.

Understanding the bias-variance tradeoff helps you:

✅ Pick the right model
✅ Avoid overcomplicating
✅ Diagnose errors
✅ Not trust every “98% R² score” you see on LinkedIn


Final Thoughts

Model performance isn’t magic—it’s tradeoffs. Sometimes the simplest model wins because the data is solid. Other times, the fanciest algorithm trips on its own complexity.

📩 Which model do you think performed best here?
Hit me up with your thoughts or overfitting horror stories.


#MachineLearning #BiasVariance #RegressionModels #ModelComplexity #XGBoost #RandomForest #KNN #Overfitting #Underfitting #DataScience