Navigating the labyrinth of logistics can often feel like assembling IKEA furniture without the manual—frustrating, time-consuming, and occasionally resulting in a piece that looks nothing like the picture. After wrestling with geography, constraints, and some very opinionated algorithms, I built a dashboard that now supports multi-stop route optimization—up to well many destinations as you want … well, if you are patient (because pushing it to 6 might melt the Streamlit servers… ask me how I know).
Why You’ll Love It:
- Multi-Stop Planning: Handle up to as many destinations in one go. It’s like having a personal assistant who doesn’t require coffee breaks.
- Fuel Stop Integration: Automatically adds fuel stops when needed, so your trucks won’t run on fumes. Because pushing a semi-truck to the next station isn’t a workout anyone wants.
- Efficiency at Its Core: Optimizes for fuel efficiency, distance, and delivery sequence, ensuring your routes are as lean as a marathon runner on a kale diet.
Under the Hood:
Powered by a constrained optimization model using Gurobi, our dashboard calculates the most cost-effective routes by considering distance, fuel costs, and truck load limits. It’s like having Einstein as your co-pilot, minus the wild hair.
Let’s face it—logistics planning is often less “fast and furious” and more “slow and suspicious.” But fear not, fellow freight folks. The Route Optimizer Dashboard is here to inject a dose of caffeine into your routing workflow (no judgment if that’s your third cup today).
The Dashy Dashy Dashboard 🙂
This dashboard isn’t just a pretty face. It’s divided into three slick tabs:
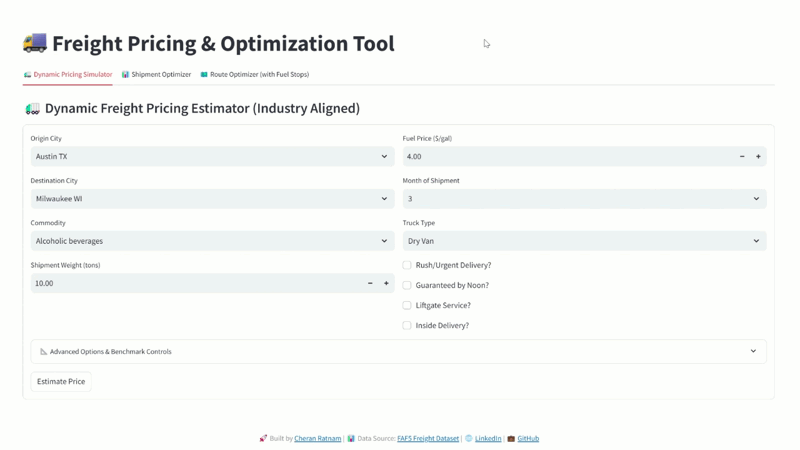
- 📦 Pricing Estimator – Give it your shipment details, and it’ll throw back a fee estimate faster than your intern can Google “freight cost per mile.”
- 🚚 Route Optimizer – Plug in your origin and your destinations, and it’ll find the most fuel-efficient route. It even adds fuel stops when needed. Because running out of gas mid-delivery is not a vibe.
- 📈 Dashboard – Visualize freight flows, trends, and performance. Yes, we made charts sexy again.
🛠️ How It Works
Input Your Destinations:
Enter as many stops as your freight-loving heart desires (and breathe). But let’s keep expectations real—it’s hosted on free Streamlit Cloud, so if you enter half a dozen points, give it 5-10 seconds to do its thing. Perfect time to sip your coffee and contemplate the mysteries of route efficiency.
Review the Suggested Route:
The backend optimizer (powered by Gurobi) will crunch fuel costs, distances, and stop sequences like a logistics nerd on Red Bull. The output? A smart route ready for action.
Hit the Road:
With your optimized plan in hand, your drivers can focus on the journey—not toggling between Google Maps and guesswork. By the way, I used the alternative fuel stations dataset for this so don’t be alarmed if sometimes the fuel station suggestion is missing or have some funky name … most likely those funky stations are electric. The data is real but I had to work with what was available.
✨Final Thoughts
In the world of logistics, time is money, and efficiency is the name of the game. Our Route Optimizer Dashboard ensures you’re not just playing—you’re winning.
This dashboard is for the data-minded logistics folks who want to stop reacting and start optimizing. Whether you’re pricing a load, planning a route, or just want to admire some interactive charts, it’s all there.
Try it out here: logistics-kk34nzr4hekiwm2tpxhrmx.streamlit.app
And hey, if it saves you even one angry client call about late deliveries, I’ll consider my job done. Need help integrating something similar for your operation? Let’s chat. This stuff’s kinda my thing.
✉️ Connect with me on LinkedIn
#Logistics #RouteOptimization #Efficiency #FuelSavings #FreightTech #SupplyChain #SmartRouting